


3 essential analytics insights for all types of businesses
In this video series, I share 3 analytics insights that different businesses can get from Google Analytics. Click one of the links below to see the video and transcript that align closest with your business. Or feel free to watch all 3, of course 🙂
3 insights for eCommerce business
3 insights for lead gen businesses
3 insights for eCommerce business
First off, I’m assuming that you’re already across your primary data such as your transactions and revenue, your most effective channels and sources, and your campaign data. Right now we’re not talking about metrics – we’re talking about the questions you should be asking to go beyond the data to find key insights into your customers, your marketing and your business.
Internal Site Search Report
The first place where we’ll find new insights is through your internal site search report. This shows you the terms people search within your website – and it’s really helpful in determining what your customers want or what they’re confused by.
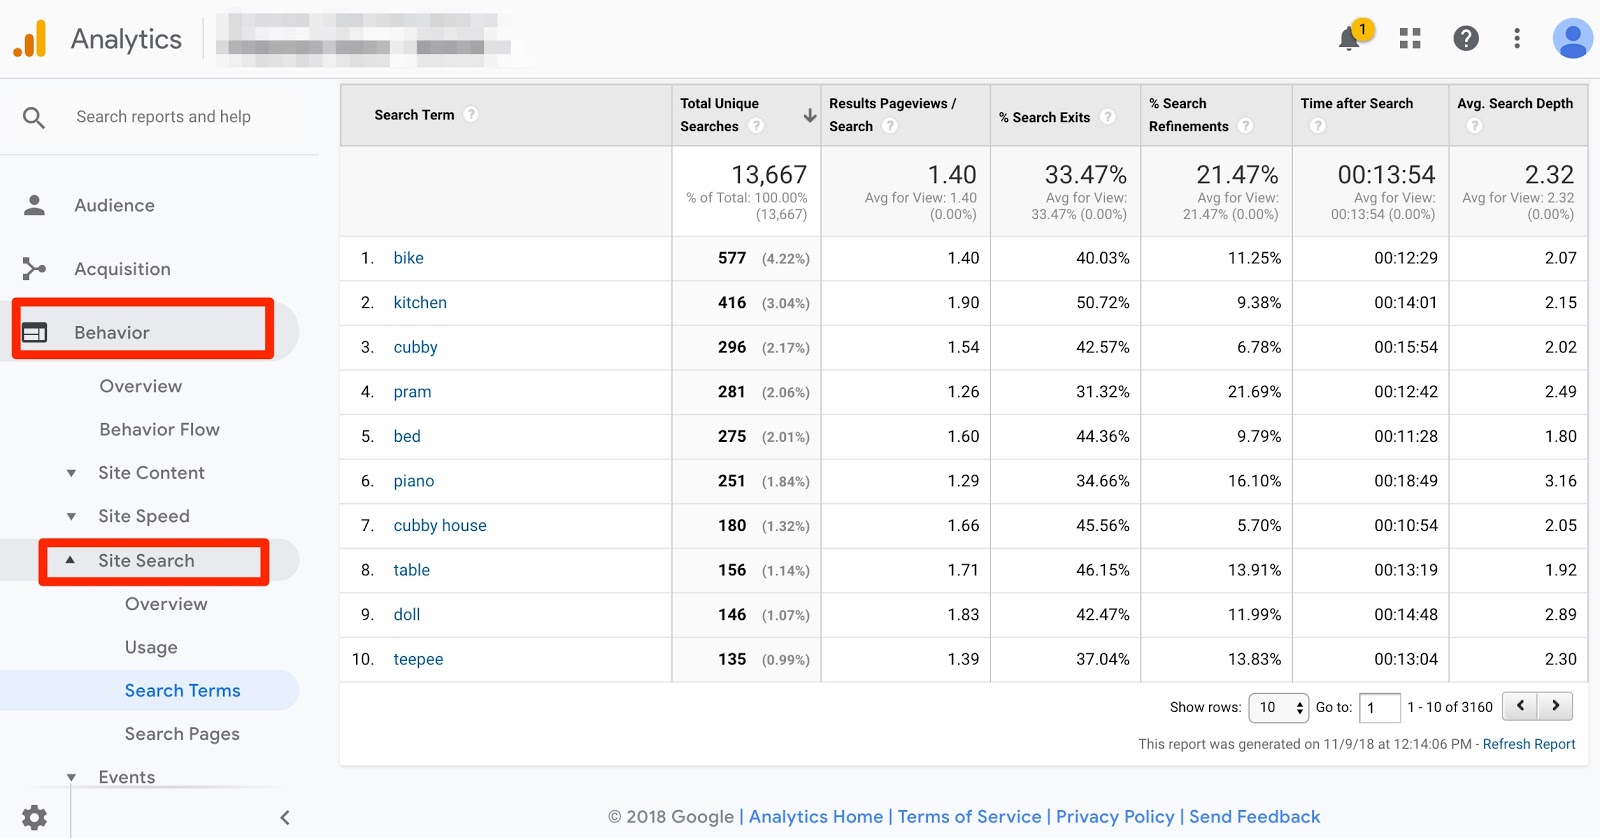
Here’s some questions to be asking when you look at the data:
- What percent of visitors are actually using the site search? If it’s a high number, does it mean that they’re struggling to find what they need?
- What are their most common searches? Can you use this information to improve your Google Ads campaigns? Or are there creative campaigns you can run based on these queries? Or could your rearrange some of your products to feature those that are being searched for most? Or maybe they’re searching for products you have in stock but they’re using different names. Regardless of what you find, I recommend if you see specific searches happening frequently, try searching them yourself so you can experience it directly.
- Another question to ask is what pages are people searching from? The home page is to be expected – but are there any that stick out as surprising? Maybe you need to improve the experience on some pages where people seem to regularly leave through a search
Time to Purchase
Our next area to find insights is the Time to Purchase and Sessions to Purchase section. This view allows you to see how long it generally takes between someone first visiting your site and then finally converting. And as an eCommerce business, you really need to understand well this customer journey.
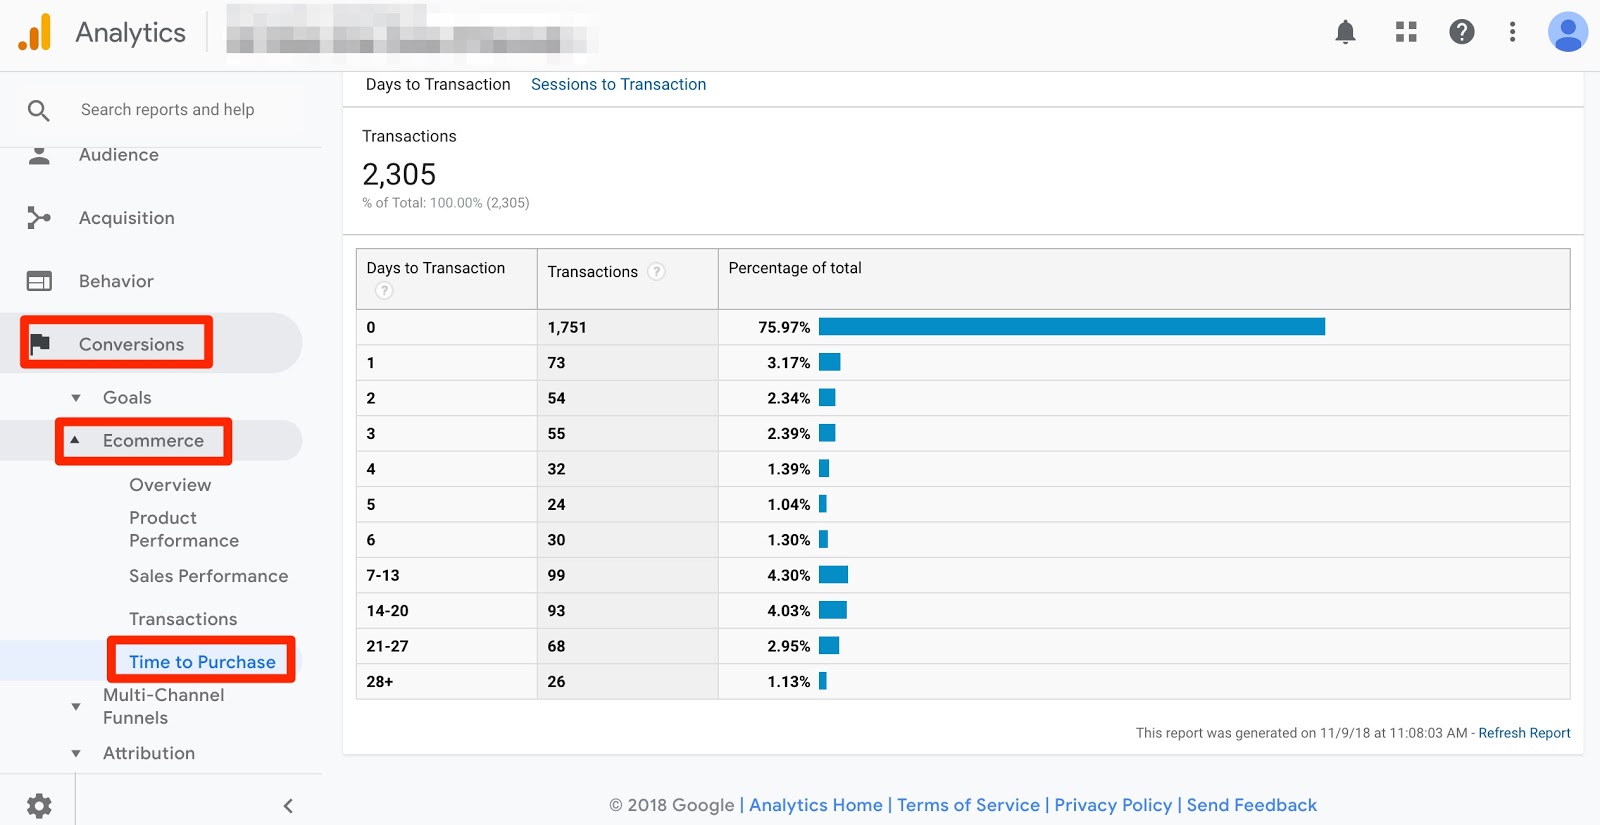
Here’s some things to focus on when reviewing this information:
- What percentage of visitors generally convert on their first visit to the site? This question alone can help inform how you want to prioritise marketing channels which may be more expensive but drive qualified traffic – specifically search advertising.
- Next you should ask how many sessions do visitors generally need before they’re ready to make a purchase and whether there’s a period of time after which people simply don’t convert.
Answers to these questions can help you to effectively develop your funnel. It also can inform how you want to leverage remarketing and email marketing activity which generally come after the initial awareness.
It’s important though to keep in mind here that this data is going to be skewed to a certain degree by your current marketing. What you’re looking for is data that differs from what you’d expect.
Model Comparison
Our last focus area for today is the Model Comparison Tool. This is where you’re able to compare different attribution models. In my opinion, one of the biggest mistakes you can make when looking at your data in Analytics is taking the conversion data at face value. This is because by default Google Analytics data is showing you conversion metrics based on the Last Click interaction. And there are lots of ways this skews your data and insights. In particular, it generally gives too much weight to the most common last click paths such as branded search or direct traffic.
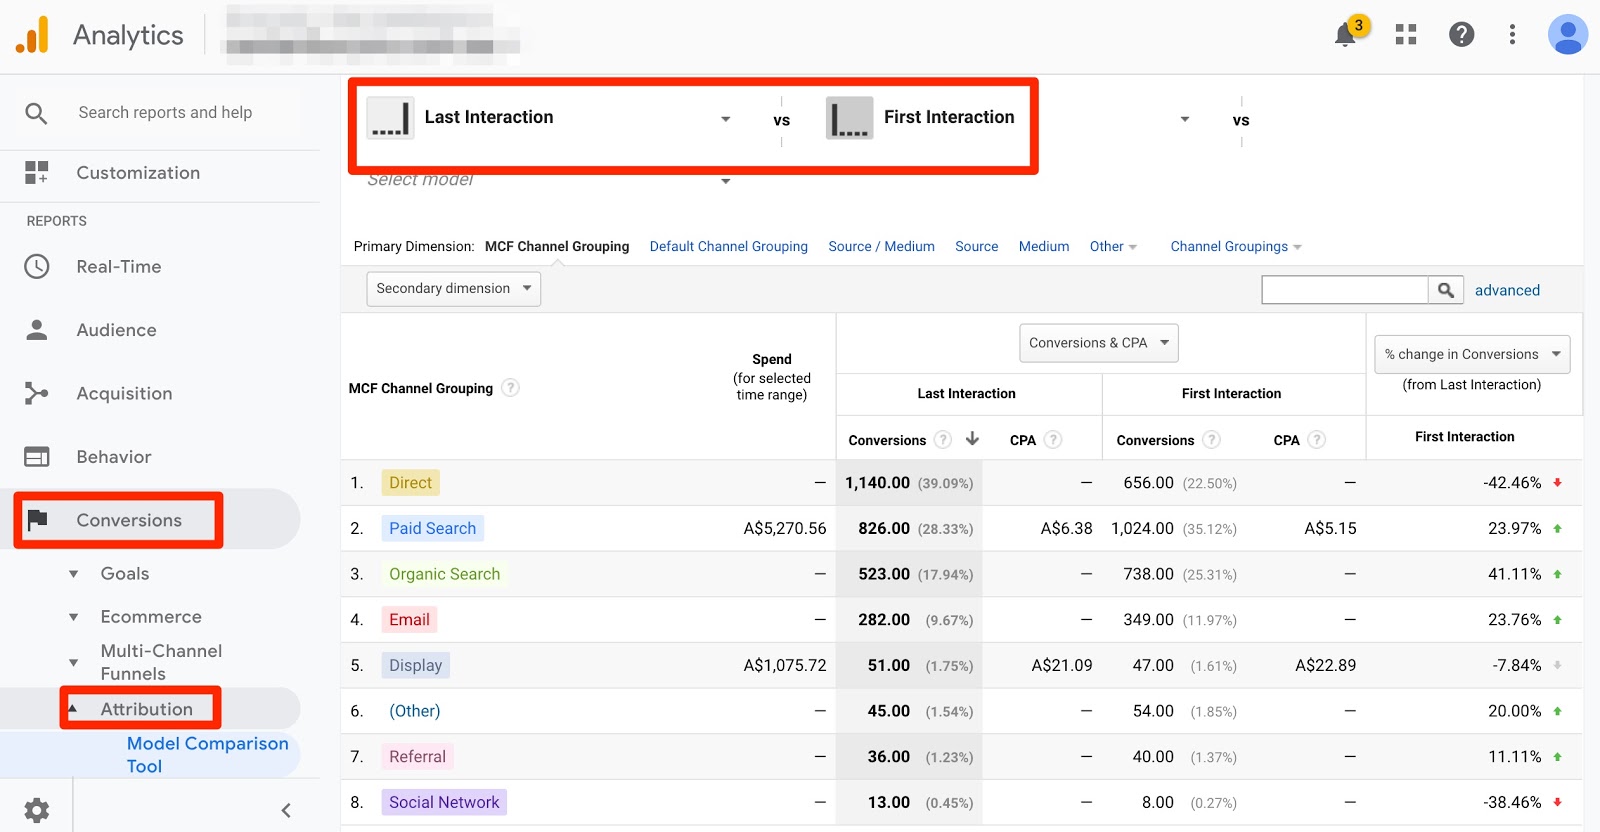
The model comparison tool is a great place to start to go deeper. Here you can review some different attribution models – such as First Click which gives data based on how visitors first came to your website, or Time Decay which gives more credit to the visits closest in time to the final conversion. Here’s some questions you should be asking
- What channels improve the most when you move from last click to first click attribution? These may be the channels that are driving your initial awareness – and therefore not getting the credit they deserve in Google Analytics’ default model. Are these being overlooked within your marketing planning?
- Another question to ask is if there are any channels which jump out at you as more or less effective when you review other models such as time decay or linear. Especially if your business has a long sales cycle, these may be the channels which are effective through the consideration phase of your funnel but not likely to drive last click conversions.
Once you begin to better understand the different attribution models, you can really start to effectively look at all stages of your marketing funnel to find new opportunities and ensure your campaigns are working together effectively
That’s it for today. If you have any questions about these three focus areas, just leave a question in the comments and I’ll get back to you. And if you want to organise an Analytics consulting session to get deeper into your data, you can email me directly.
Thanks for watching.
3 insights for lead gen businesses
Once again, we’re assuming here that you’re across all your primary data and metrics. This series is about the questions you should be asking to go beyond the data to learn about your customers, your marketing and your business.
Assisted Conversions
We’ll start with Assisted Conversions, which measure all the marketing touchpoints in your marketing campaigns prior to the final conversion. For businesses with relatively long lead times, there are likely multiple ways that people come to your website before they actually fill out a form to convert, and this report will help you to understand which channels are most effective in the lead up to conversion.
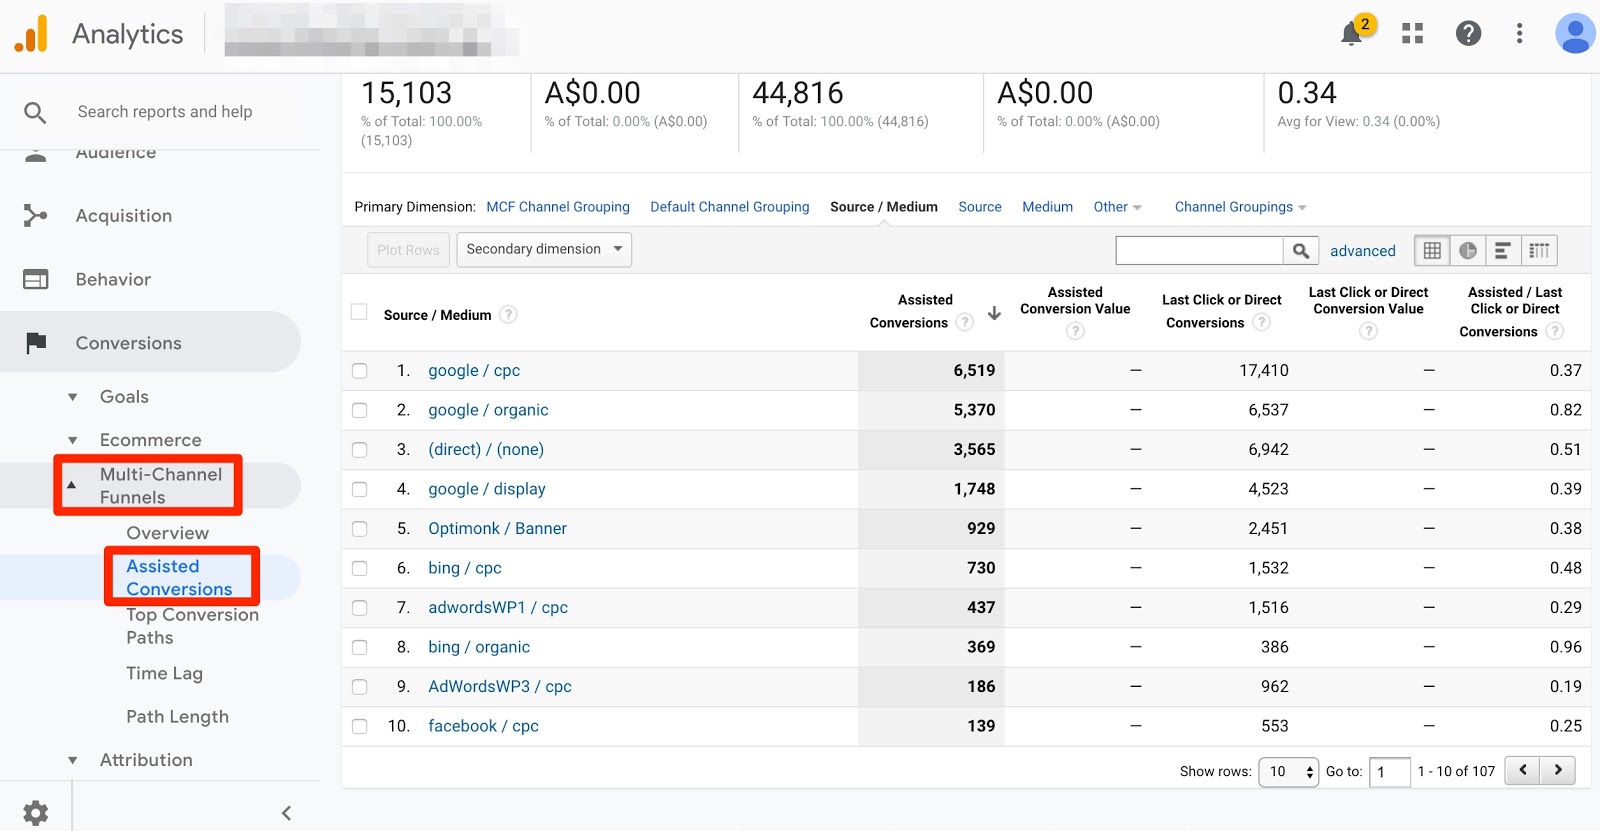
Here’s a few questions you should be asking around this report:
- The most obvious is to look at what sources have the most assisted conversions and thus play the largest role prior to the final conversion. If there are sources you’re not prioritising which perform well, you may find opportunities here to improve your sales funnel as you understand better your customer journey.
- The next question to ask is if there are any channels which have a really high ratio of assisted conversions to conversions. The higher that ratio, the more likely these are to be channels in the middle of your marketing funnel. So you should be reviewing if the content you’re promoting here fits the customer mindset. Alternatively, if you see channels that have very few assisted conversions but high last click conversions, these may be the places to focus the most on in terms of optimising for leads.
Exit Pages
The next area we’ll look for insights is in your Exit Pages report. This shows the specific pages where visitors are most likely to leave your website.
Before reviewing this report, you should think about how you expect people to experience your website. Ask yourself where you think people are most likely to exit the site and why they would choose to do so. It may be that they’ve read a piece of content and then are simply moving on, or they may be in the process of considering your service so reading about your business but not ready to convert.
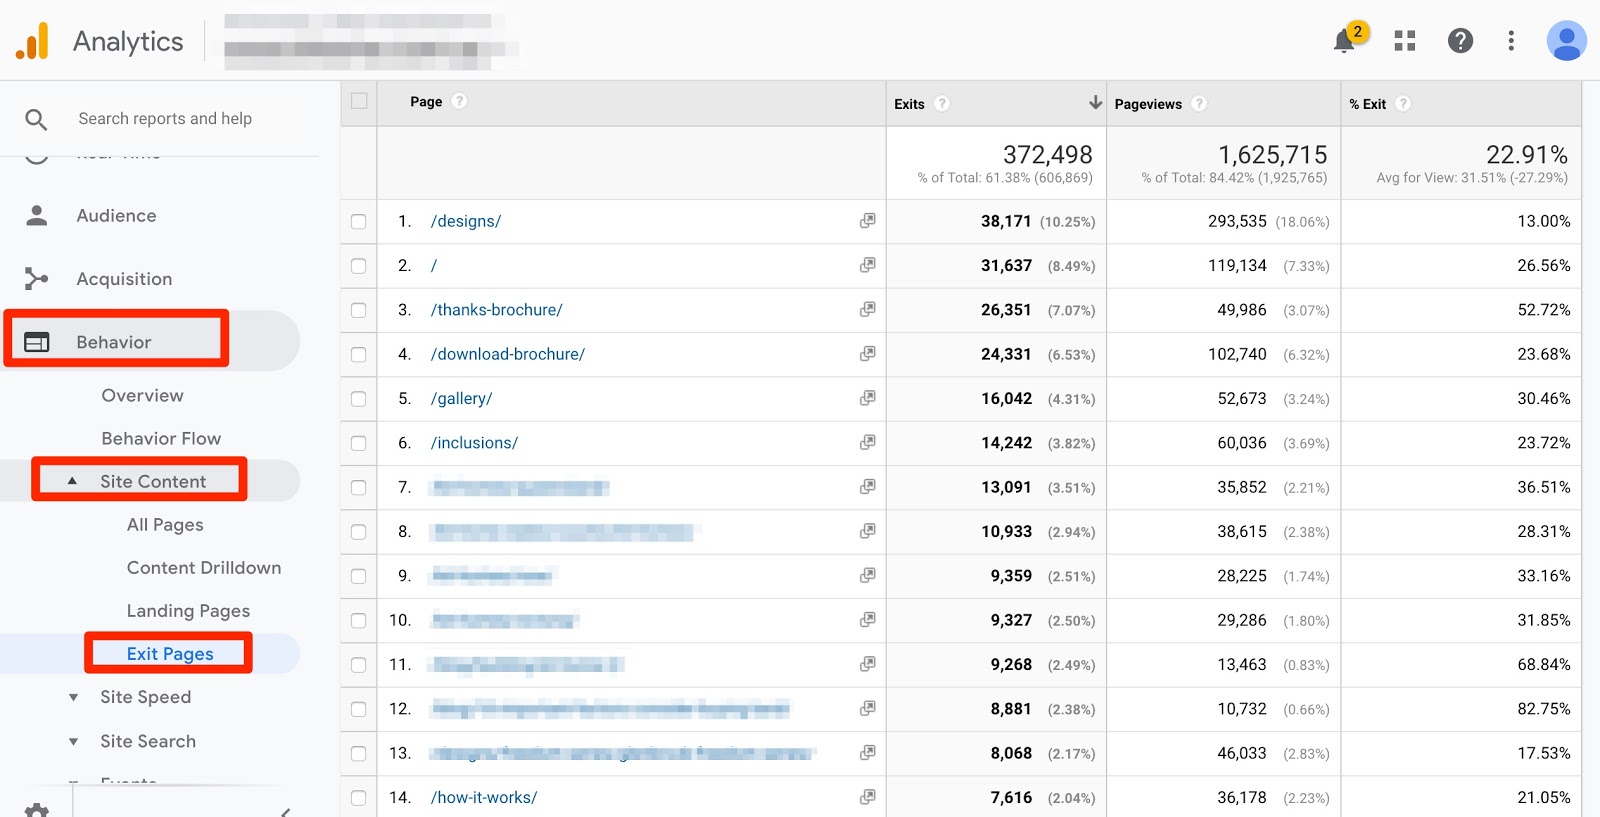
- When you review this report, you should be looking for pages with both a high number of exits and pageviews, that also have a high exit rate. These are pages which lots of people are going to and then a high percentage choose to leave. Some pages you may expect – such as the thank you pages for your forms. But for others there may be something about the experience on these pages which is causing people to lose interest. Go check out these pages yourself to see if something jumps out at you. You can also install a heat mapping tool like Hotjar to review exactly how people use these pages. Making an improvement here could have a big impact on your bottom line over time.
- Another question to be asking is if there are any pages which have high pageviews and extremely low exit rate. Ask yourself why people continue on from these pages and if there’s something that can be replicated across other less effective pages. Also you can look into the pages they go to next and ensure they’re getting a great experience on the following pages.
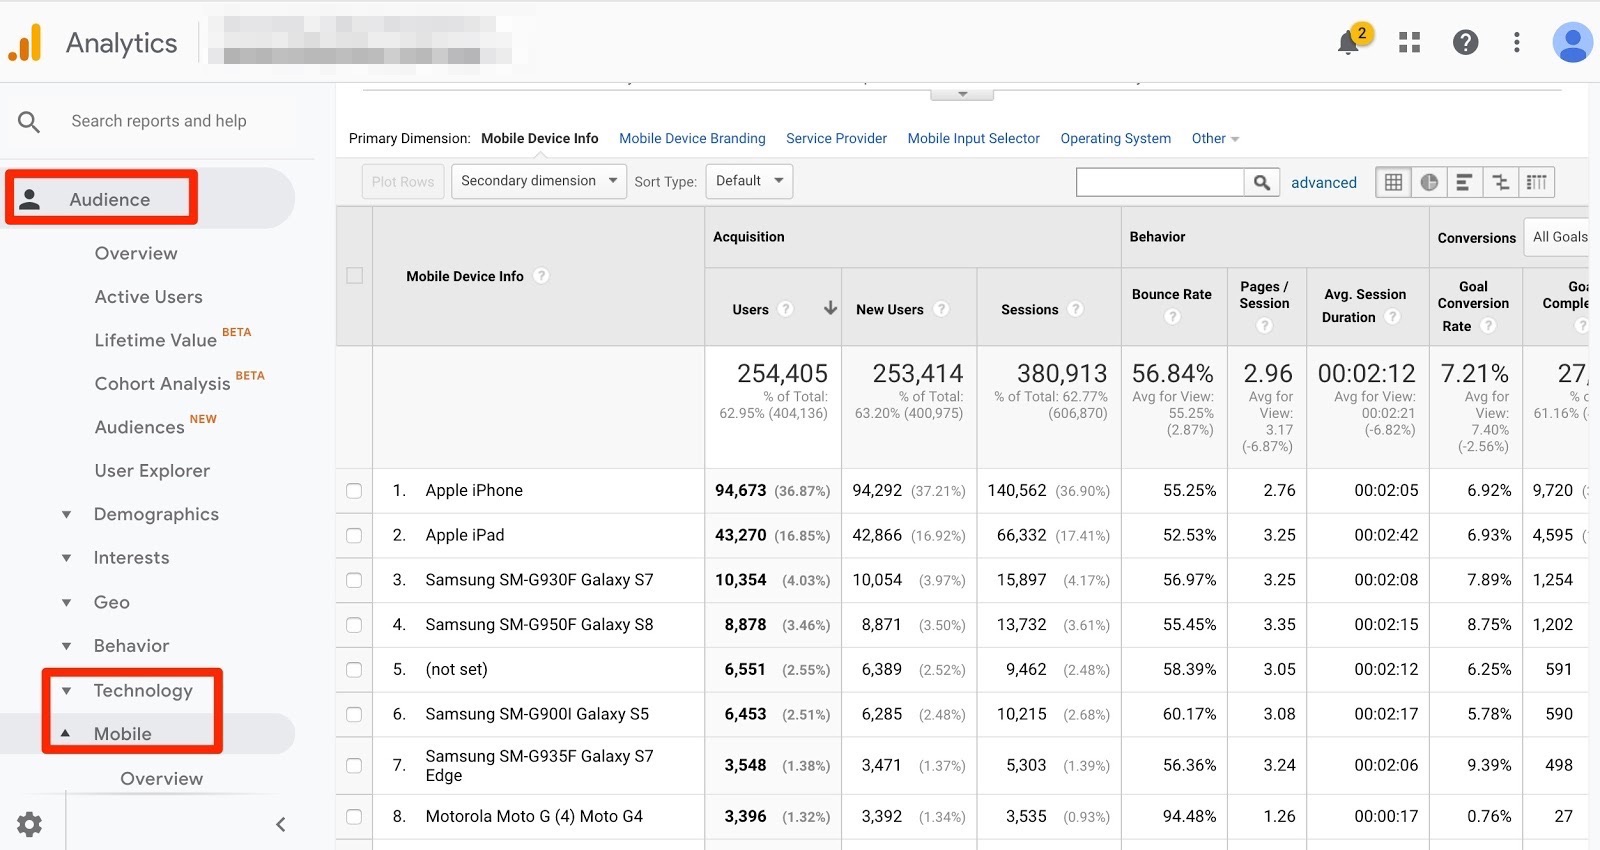
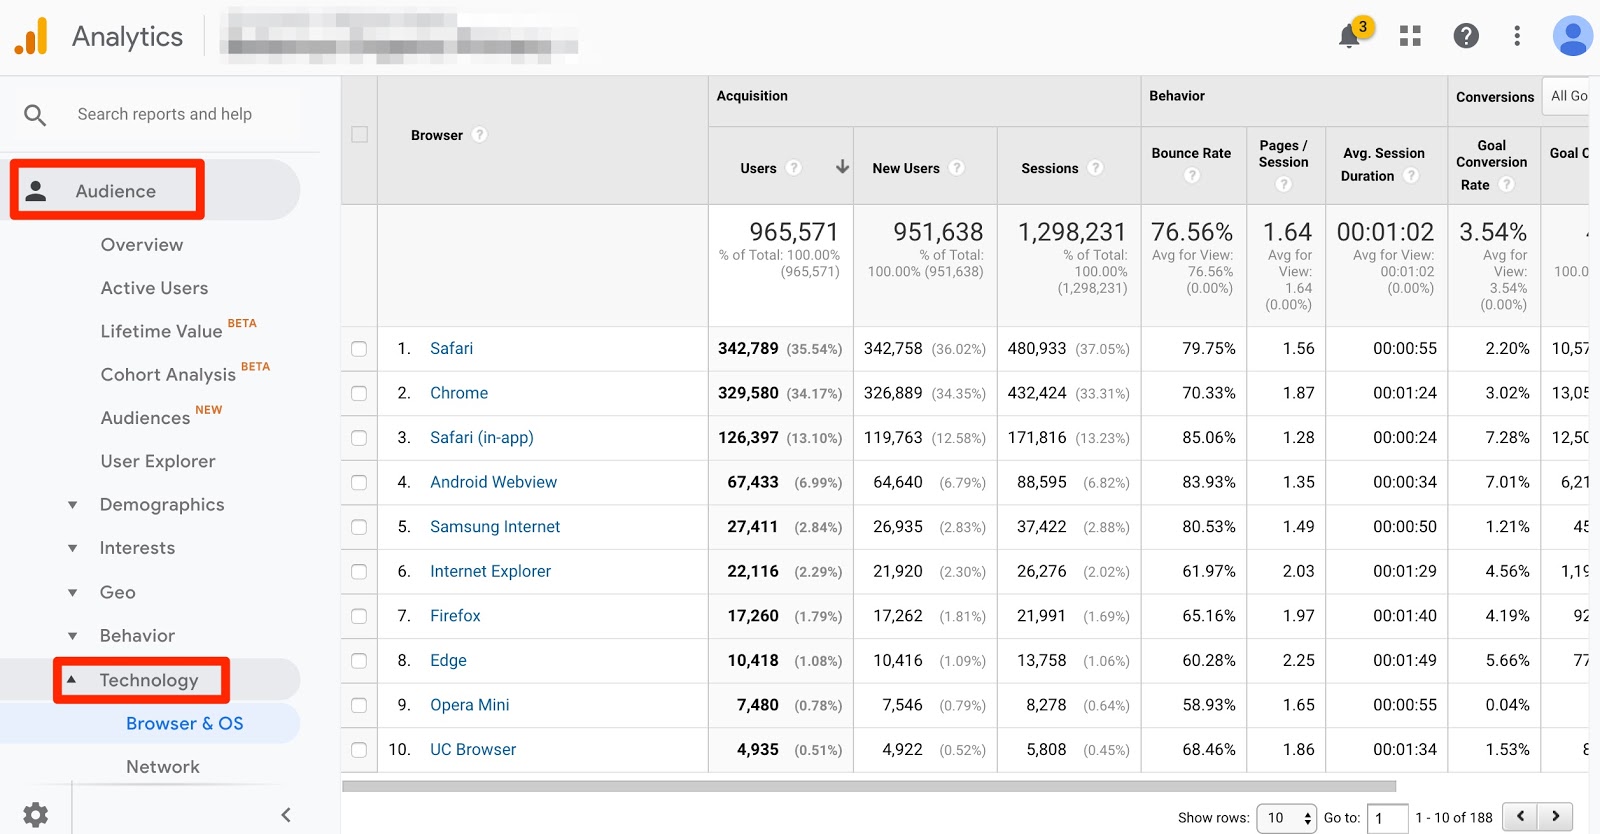
Technology
Our final area for insights into your lead gen campaigns is in the Device, Browsers, Networks and Operating Systems. This report will help you to determine if there are opportunities to directly improve your website experience on specific tech which can drive more conversions.
- You’ll first of course want to look at the overview of how your site performs on mobile, tablet and desktop – as well as the percent of visitors using each of these. If you see that mobile has high traffic and low conversions, you need to dig deeper into this and determine if it’s your website experience or your marketing which is driving these results. For example if you’re promoting content heavily on Facebook which is almost exclusively mobile traffic, this may be an important part of your marketing funnel that’s unlikely to drive final conversions so you’d expect a low conversion rate. But if traffic to your key landing pages isn’t converting, this is an area to try to improve.
- Beyond simply mobile and tablet though, you’re also able to look at specific devices and operating systems that people use. Reviewing this report, you should be looking for any anomalies. If you see any devices or operating systems that have conversion rates much lower than the rest of your site, go check them out. It could be that there’s something about your site which is causing a different experience in these cases. If you’re not able to actually test on the device, you can use a tool like Browser Stack to review the experience.
That’s it for today. If you have any questions about these three focus areas, just leave a question in the comments and I’ll get back to you. And if you want to organise an Analytics consulting session to get deeper into your data, you can email me directly.
Thanks for watching.
3 insights for brands
In my experience, marketers often really struggle with effectively leveraging analytics for brand campaigns, and instead rely too heavily on top level metrics like traffic and impressions. And yet the data within these campaigns provides some great opportunities to learn about who your customers are, what they’re interested in and how your brand is growing. So let’s get into it.
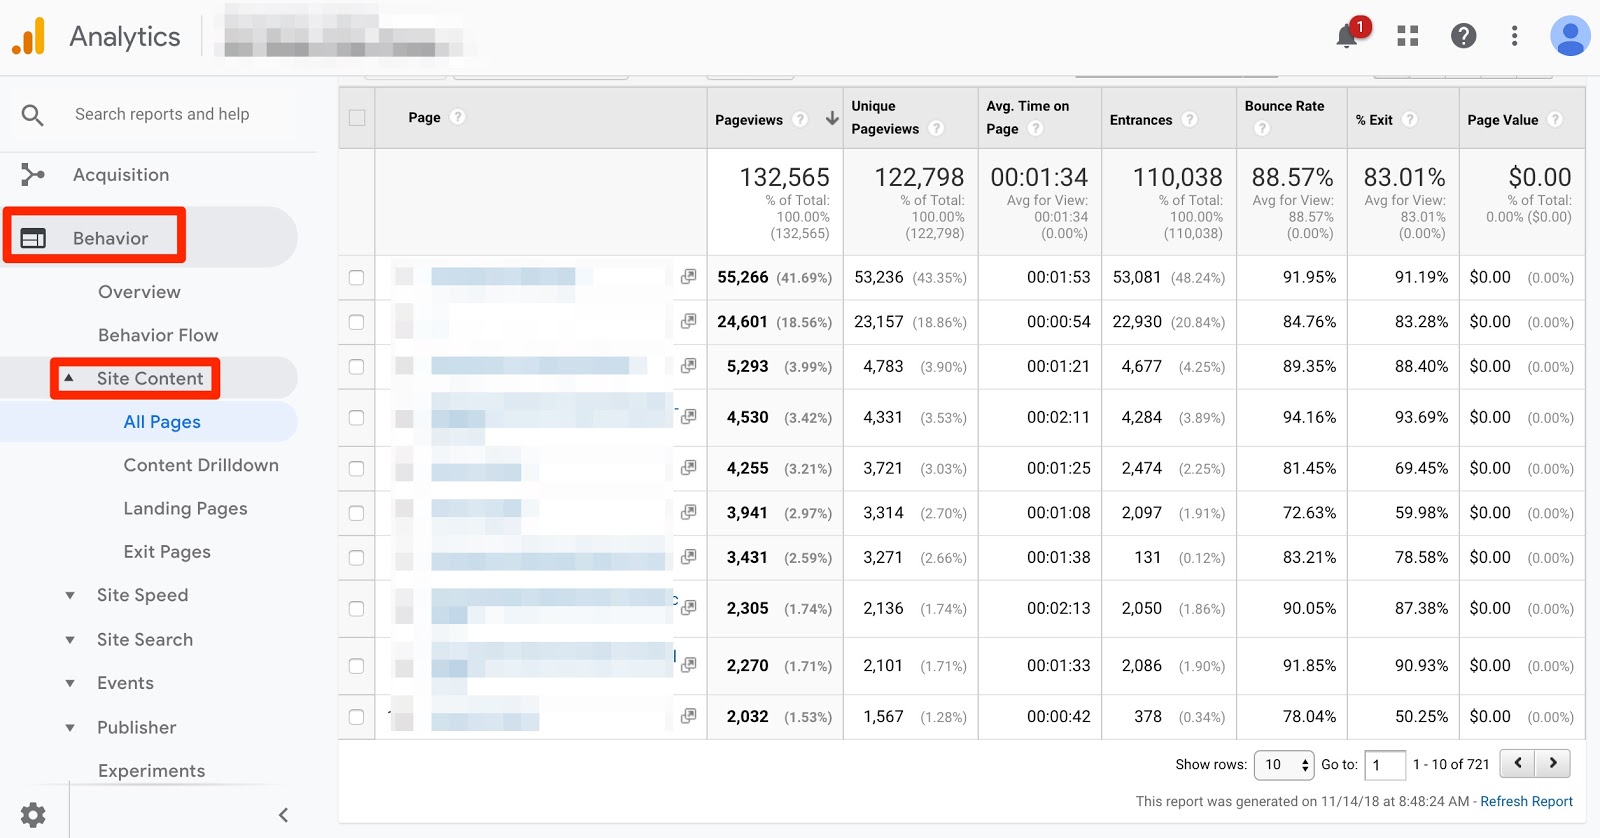
Pageviews
The first place we’ll start is the pageviews report where we can learn some valuable insights into what is most important or interesting to your visitors.
Here’s the questions you should be asking:
- Beyond what pages do people go to most, what pages are they spending the most and least time on? This can give you insight into what’s most important to them and what questions they have about your brand or products.
- Another question to ask is if there are any pages which have a lot of views but low entrances. These are the pages that people are consistently navigating to internally, and thus highly important for them once they’ve landed on your site. Review the exit rates on these pages to see if people are leaving in high numbers – maybe you’re not providing the information they expect. I also recommend going to the pages individually to see the experience and information you’re providing. There may be some easy improvements you can make.
Affinity
The next area we’re going to turn to for insights are Affinity Categories and In Market Segments. These are areas where you can find insights on what the people who visit your website are most interested in and are actively purchasing.
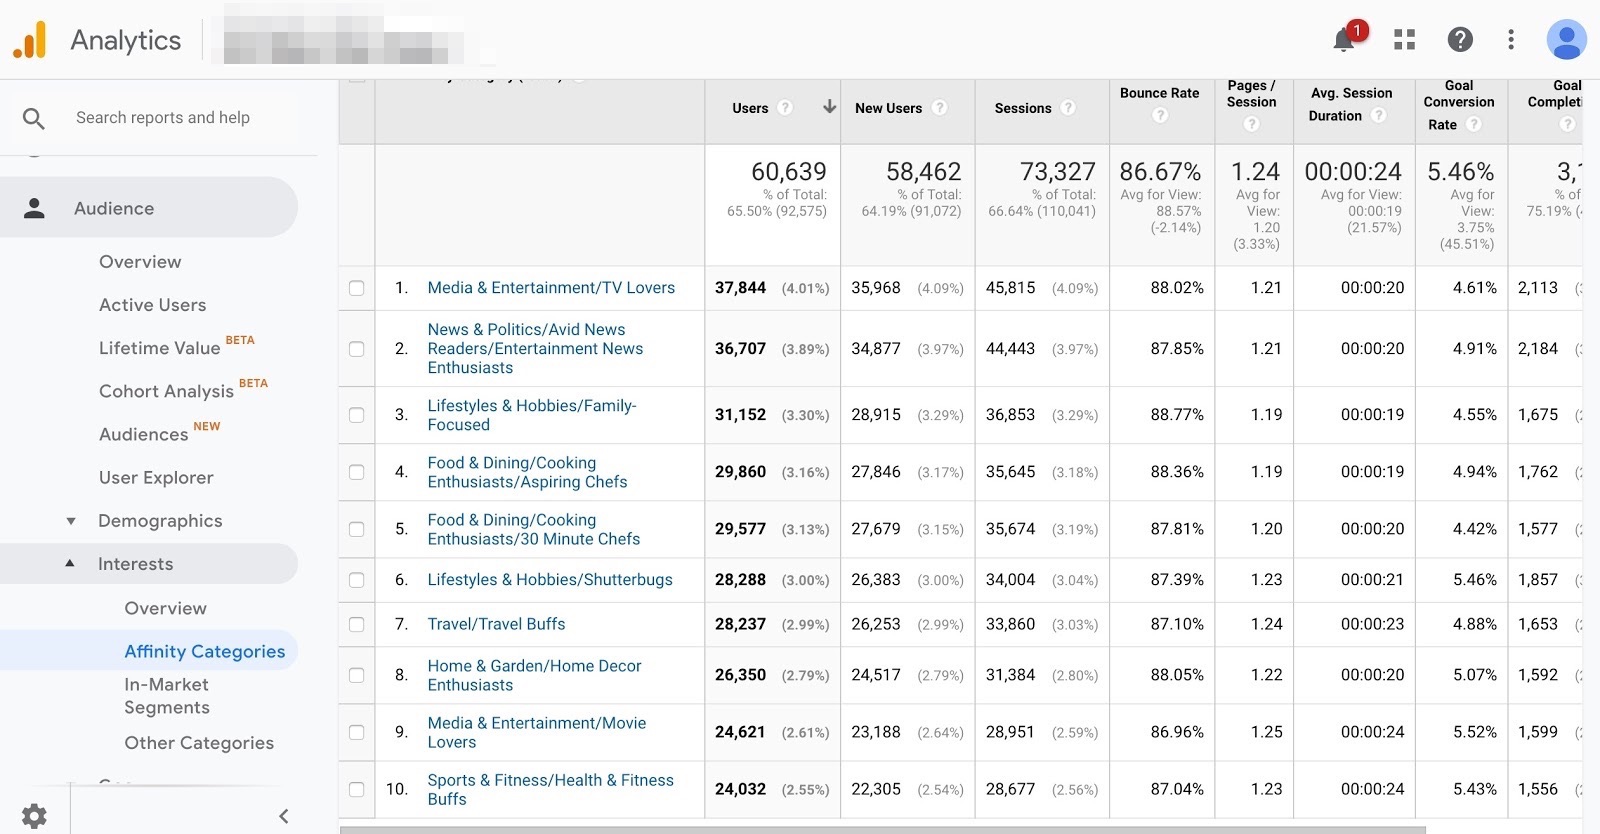
- Affinity categories help to give you a picture of your website visitors’ overall lifestyle. One question to ask is if you think the type of people who are visiting your site are likely to be interested in your product. For example, if you sell high end food products and one of your top affinity categories is Aspiring Chefs, that’s likely a strong match. But if you’re a fast food company and your biggest audience is Health & Fitness Buffs, that might be off. You can then look back at your campaigns and creative to determine if there’s a reason you’re driving the wrong people to your site.
- You should also review if there are any affinity categories which have higher overall engagement with the website in terms of pages per session and time on site. These may be a niche segment you could run a campaign towards specifically – or you could set them up with a seperate marketing campaign with some creative focused specifically on their interests.
- The In Market Segments section is similar but provides insights on what visitors to your website are actively looking to purchase. This is based on their search history and the websites they’re visiting. You should be asking if your campaigns and creative align with what’s most important to these groups. If you’re running a competition, you could choose a prize from among these topic areas.
Brand Growth
Our final area for insights is around measuring your brand growth, which is particularly important to understand if you’re making big investments in brand campaigns. There are three areas I recommend reviewing for brand growth: your branded organic search traffic, your branded paid search campaigns and your direct traffic. You can measure your branded organic search through the Search Queries report which gives you clicks and impressions for your branded keywords.
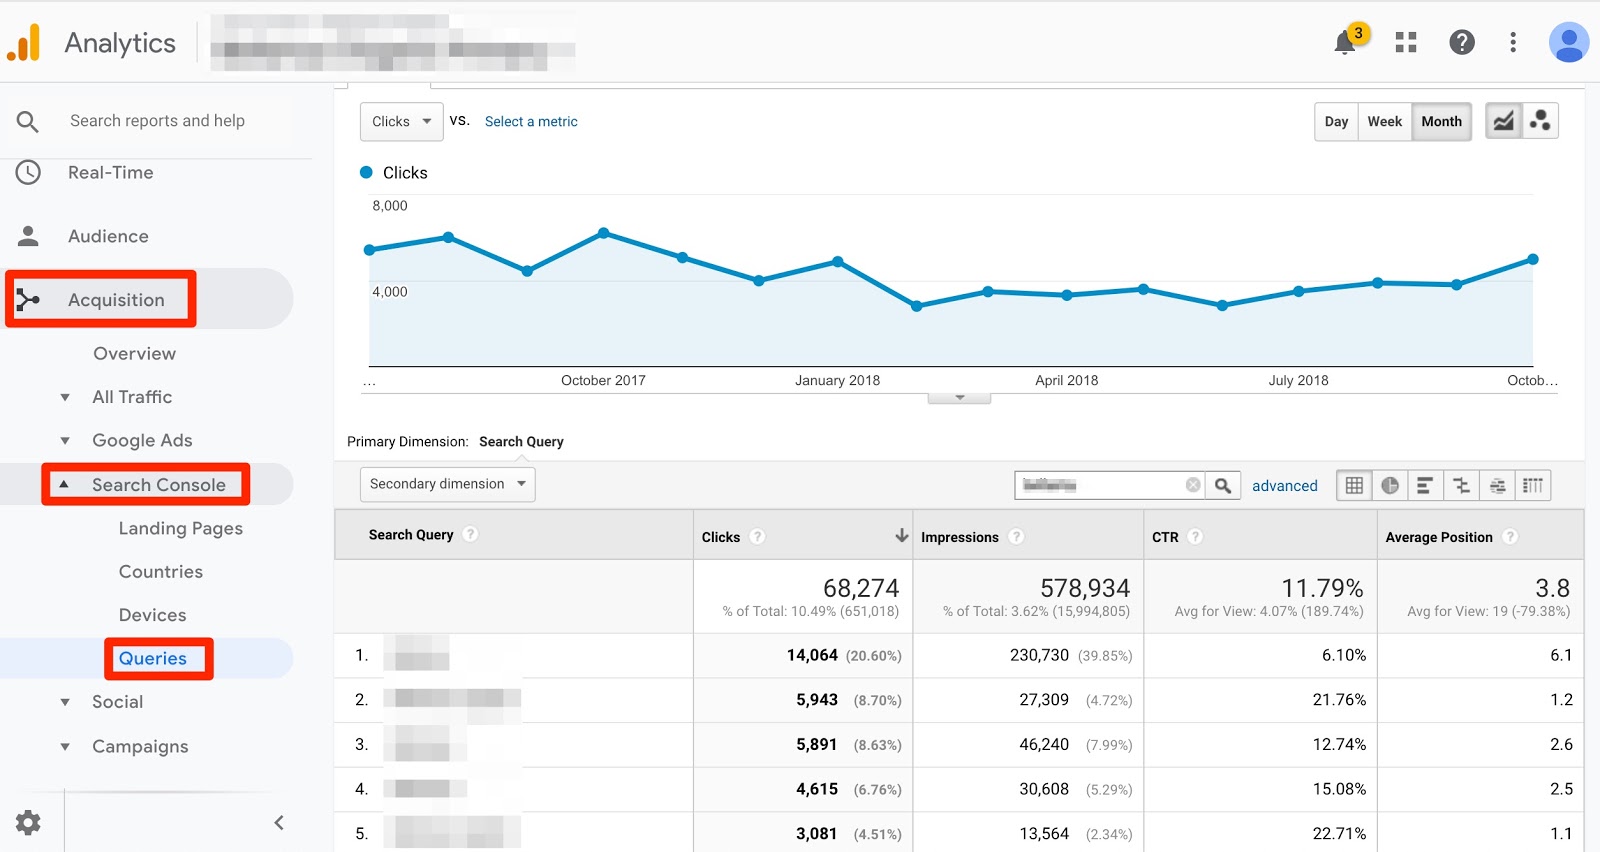
Paid search campaigns are visible in your Google Ads report while Direct traffic is in your Channels report.
These three metrics give you an overview of interest in your brand online over time as they represent people who already know your brand and are actively going to your site.
- When you look at this data, you should start by asking if it aligns with your campaigns or marketing activity. Are you seeing an increase in branded and direct traffic as a result of the campaigns you’ve previously run? Are there any specific campaigns or activities that you can see had an oversized impact?
- Another question to ask is if there are any outliers in terms of high branded traffic which don’t align with your campaigns. Were there media mentions or viral activity which had a big influence? And can you replicate any of that to continue to grow?
You should then track this ongoing as one measure of brand growth that’s easily accessible and transparent – which isn’t always the case in terms of other brand measurements.
That’s it for today. If you have any questions about these three focus areas, just leave a question in the comments and I’ll get back to you. And if you want to organise an Analytics consulting session to get deeper into your data, you can email me directly.
Thanks for watching.

Ben Fitzpatrick
Across the business, he is constantly working with the team to innovate and improve in order to keep Webprofits at the forefront of digital marketing.


Thanks Ben, I learned something new from you. 🙂